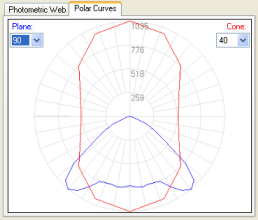
The Polar Curves tab contains a display of luminous intensity (candelas) for the IES photometric file associated with the luminaire family type. There are typically two curves plotted on the polar background: a vertical slice, in blue, through the light distribution in the plane of maximum intensity, and a horizontal cone, in red, circumscribed around the light distribution in the vertical angle of the maximum intensity. The blue curve can be imagined to be an elevation view looking at the vertical slice, while the red graph is a plan view of the light distribution when sliced through the maximum-intensity vertical angle.
The graphs are labeled, and the angles can be adjusted as desired.